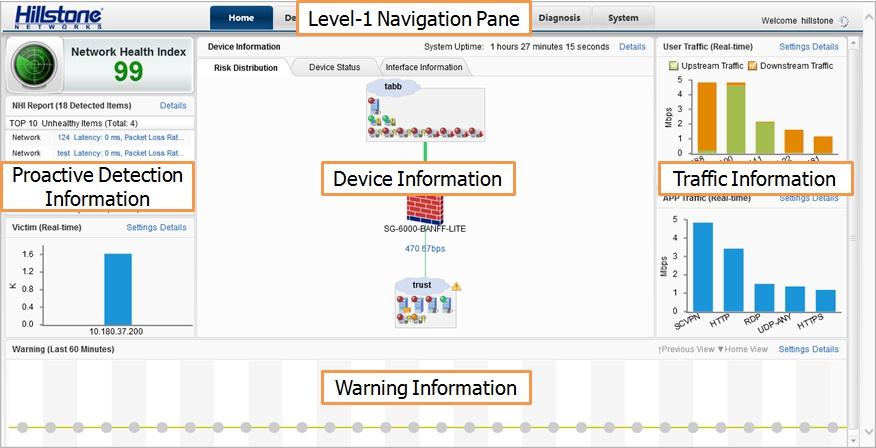
The home page shows the system information, such as proactive detection information, device information, traffic information, warning information, and so on. All the data displayed on the home page refreshes in every 30 seconds. The layout of the home page is shown as below:
The level-1 navigation pane shows the main function tabs of the software and the current login user's information. Options on the level-1 navigation pane are described as below:
| Option | Description |
|
Home/Detection/Monitor/Warning/Policy/Diagnosis/System |
Click each tab to go to the corresponding function pages for reading and configuring. |
|
Tools |
The following tools are provided:
|
The proactive detection information includes the network health index (NHI) of the system, and the summary of unhealthy and subhealthy items.
| Option | Description |
|
Network Health Index (NHI) |
Shows the NHI of the system. The HNI is calculated by the system based on the proactive detection data. Three types of health status are supported:
|
|
NHI Report |
Shows the summary of the unhealthy and subhealthy items.
|
The device information includes risk distribution information, device resource utilization, device physical status and system information. The descriptions are listed below:
| Option | Description |
|
System Uptime |
Shows the uptime of the system for the latest login. Click Details to go to the monitor page for more detailed information. |
|
Risk Distribution |
Risk distribution uses a topology to show the security status of the network where the Hillstone device is deployed. The topology is composed by the Hillstone device, zones configured on the Hillstone device, and service/network nodes and hosts in each zone. From the topology, you can get the following information: Device resource information: The zones that have traffic in the latest 1 hour are displayed around the device. The WAN zones are displayed on the top in the topology and at most 3 WAN zones are displayed. The system gathers the following three types of objects' statistics in zones to show the risk distribution status: service and network nodes, abnormal hosts, and threat hosts.
Service and network node information, host information and server information in a zone: The service and network nodes, abnormal host, and threat host in a zone are shown below the zone icon. Do the following actions to get more information. Notes:
|
|
Device Status |
Shows the firmware information, hardware information, total traffic, and session information:
|
|
Interface Information |
The device front panel shows the interface status of the device.
Move the mouse over a interface icon to see detailed interface information. The interface traffic chart shows the interface traffic statistics in a certain time period.
|
The user traffic and application traffic chart are displayed on the home page.
| Option | Description |
|
User Traffic |
The top 5 users by traffic are display in a bar chart.
|
|
APP Traffic |
The top 5 applications by traffic are display in a bar chart.
|
The warning messages generated in a certain time period are shown with a warning distribution timeline.
| Option | Description |
|
Time Warning |
Shows the number of warning message in a specified time period. The warning levels are described by circles in different colors:
Do the following operations to read the related information:
|