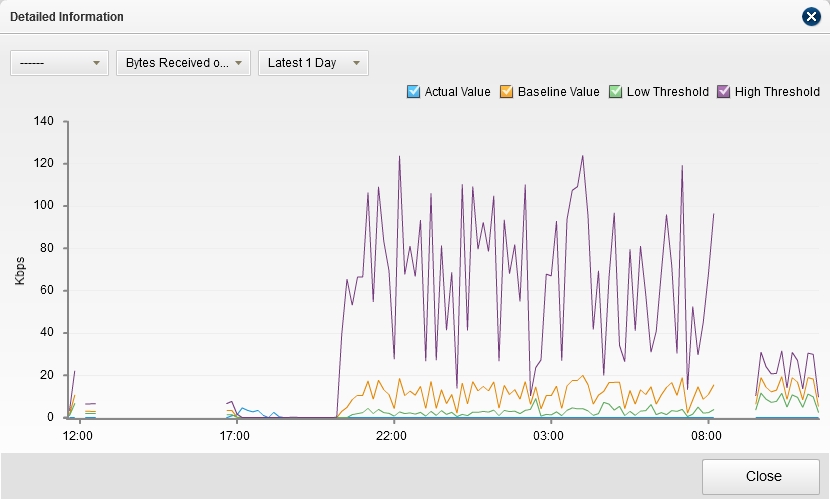
From the upper left corner, select application, parameter and time period from the drop-down lists to see the corresponding trend chart.
Detection > Risk Object > View Alerts
On the risk object page, you can:
A trend chart and a table with detailed threat information are displayed on the page for you to see the threat information (host/server only).
The trend chart shows the attack and attacked number of the detected object.
The threat table shows the detailed threat information, and the description of each option in the table is:
| Option | Description |
|
Attack Occurring at |
Shows the time when the attack happens. |
|
Severity |
Shows the attack severity. |
|
Attack Name |
Shows the name of the attack. |
|
Attacker |
Shows the source of the attack. |
|
Victim |
Shows the victim of the attack. |
|
Attack Type |
Shows the type of the attack. |
|
Number of Attack |
Shows the count number the attack happens. |
|
Zone |
Shows the zone the attack belongs to. |
|
Interface |
Shows the interface the attack belongs to. |
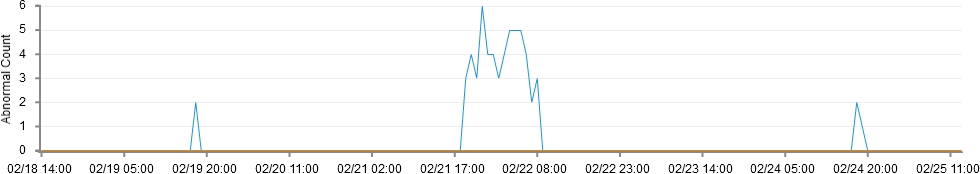
The system analyses the abnormal parameter values and figures out whether abnormal behaviors exist. The trend chart shows the count number the abnormal behavior happens. See the screenshot below:
The abnormal behavior table lists the detailed information of the abnormal behaviors and provides the related operations. The options in the table are:
| Option | Description |
|
Start Time |
Shows the time when the abnormal behavior starts. |
|
End Time |
Shows the time when the abnormal behavior ends. |
| Severity | The system defines a severity level for the abnormal behavior based on its type and abnormal degree. There are three levels which are high, middle, and low, and you can take proper actions according to the severity level. |
|
Abnormal Behavior |
Shows the name of the abnormal behavior. |
|
Role |
Shows the role of the detected item in the abnormal behavior (can be the attacker or the victim). |
|
Suspected Object |
Shows the source information of the abnormal behavior, including the source IPs, and the attack count of each source. |
|
Detailed Information |
Click View to see the detailed information about the abnormal behavior, including the abnormal value of the parameter, the high and low threshold and the baseline. |
|
Ignore |
Click Ignore to make the system ignore the corresponding abnormal behavior. Select the check boxes of the abnormal behaviors, and then click Ignore in the table header to ignore all the selected abnormal behaviors. The ignored abnormal behavior will not contribute to the health score of the detected object. |
|
Restore |
Click Restore to restore the ignored abnormal behavior. Select the check boxes of the abnormal behaviors, and then click Restore in the table header to restore all the selected abnormal behaviors. The restored abnormal behaviors will contribute to the health score of the detected object again. |
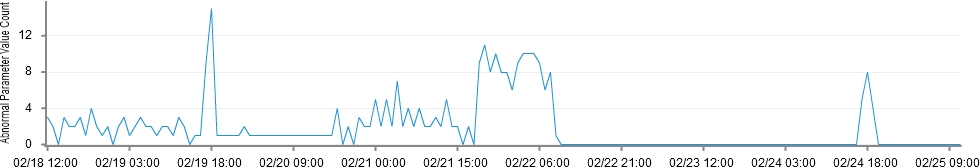
The trend chart shows the count number the abnormal value of the parameter happens. See the screenshot below:
The abnormal parameter value table shows the detailed information and provides the related operations. The options in the table are:
| Option | Description |
|
Start Time |
Shows the time when the abnormal value starts. |
|
End Time |
Shows the time when the abnormal value ends. |
| Severity | The system defines the severity level of the abnormal value according to the offset between the actual value and the high threshold or low threshold. There are three levels which are high, middle, and low. The more the offset is, the high the level is. |
|
Application |
Shows the application information if there is any. |
|
Parameter |
Shows the parameter name. |
|
Parameter Value |
Shows the actual value of the parameter. |
|
Low Threshold |
Shows the low threshold of the parameter. |
|
High Threshold |
Shows the high threshold of the parameter. |
|
Detailed Information |
Shows the detailed information of the abnormal value, namely the actual value, the high and low threshold and the baseline trend information. |
|
Ignore |
Click Ignore to make the system ignore the corresponding abnormal value. Select the check boxes of the abnormal values, and then click Ignore in the table header to ignore all the selected abnormal values. The ignored abnormal values will not contribute to the health score of the detected object. |
|
Restore |
Click Restore to restore the ignored abnormal value. Select the check boxes of the abnormal values, and then click Restore in the table header to restore all the selected abnormal values. The restored abnormal values will contribute to the health score of the detected object again. |